
DOB
What is DOB.
DOB stands for Double Or Bust and is a method of trading horses that we believe will shorten in price in running.
The method has been around for a while and with the right research can be a valuable method to add to your profit making portfolio.
How Does It Work?
We try and find selections that we believe will shorten in price in running, we place a BACK bet just before the race starts and then place our LAY bet (set to keep in play) to hopefully get matched during the course of the race.
We are looking for potential selections that we believe will at least half in price in running to make a profit of 1 point.
We either lose 1 point (if the selection does not shorten enough in running) or
We win 1 point (if the selection shortens to the required price during the race).
Our selections do not have to win the race they just need to look like they have a decent chance during some part of the race for the price to steam and our in running LAY bet to get matched.
HOW DO WE IDENTIFY POSSIBLE SELECTIONS?
Our Back 2 Lay tool can help with our research is currently free to use and provides some historic data on how each horse has performed in running in previous races. For details please see the FREE USER page here
Once registered you will be able to access the information required to start filtering out our selections. There are many ways you may wish to filter the runners but one that has been working well for me to generate an initial shortlist is;
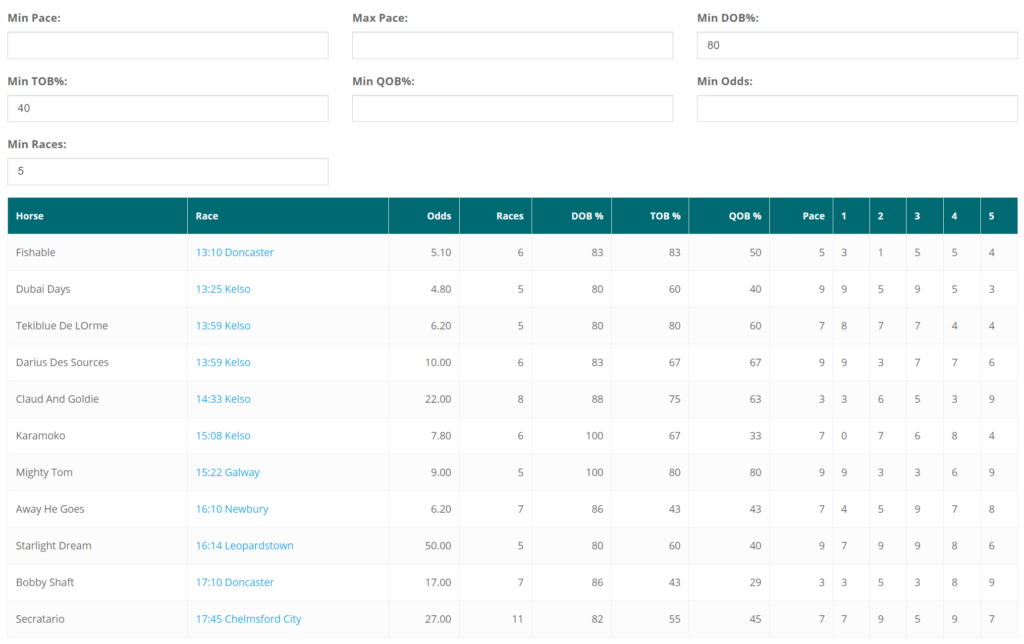
Step 1 – using B2L List View we make a list of selections that have DOBBED (at least halved in price in running) in 80%+ of its races and must have raced at least 5 times – see example below
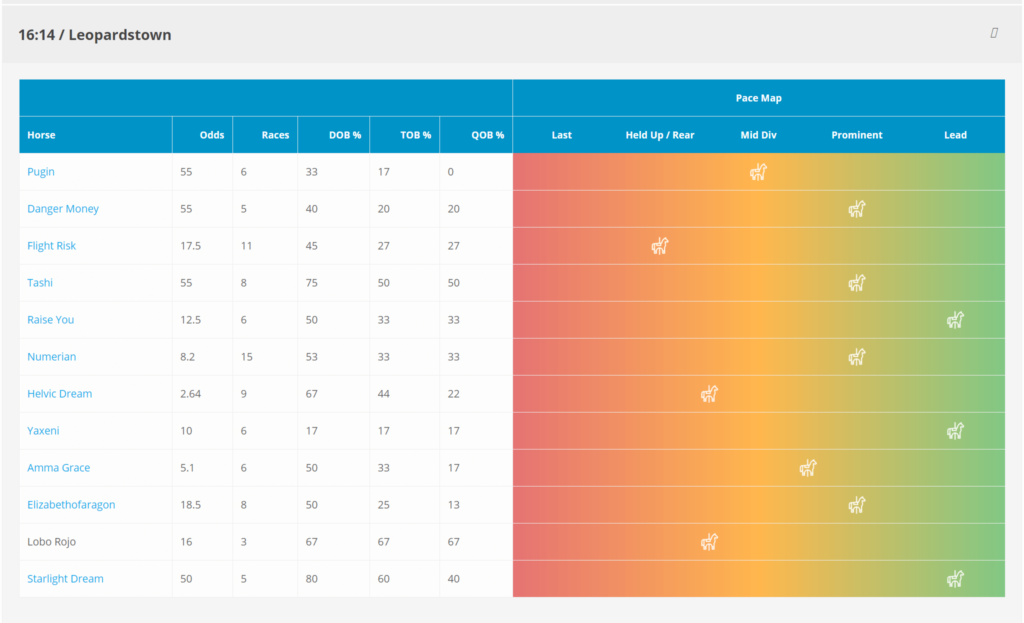
Step 2 – we then switch to B2L Racecard View to look at each race for each selection in more detail. Lets take a look at 16:14 Leopardstown
Step 3 – Analyse the race and data to see if the selection should remain
Lets take a look at the steps in more detail
STEP 1.
In the Trade Ninja Member dashboard click the “B2L List View”. This will then list all of the days runners with an overview of how each horse has performed in running in previous races. (a more detailed user guide for this tool can be read here)
Our 1st step is to set the filters to our requirements. We may all have our own preferred values to use but a suggestion could be to only show horses running today that have DOBbed in at least 80% of its races, so we would enter 80 in the “Min DOB%” field. This then instantly updates the list only listing horses running today with a DOB rate of 80% or above.
Once we have our list we now need to make some additional checks to back up our belief that our selection will DOB again.
STEP 2.
We now need to switch to “B2L Racecard View” which can again be found in the Member Area Dashboard. This provides a list of all the days races which we can click to open up the runners for each race so we can compare the data
The image above shows the racecard view for the 16:14 Leopardstown and we can click on any horse to bring up the a list of races where the horse has previously run and how it has performed in running.
Looking at Starlight Dream we can see it has run 5 times previously, DOBbed in 80% of these races (4 out of 5) and likes to race at the front. By Clicking the name of the horse we can then see the data for each race
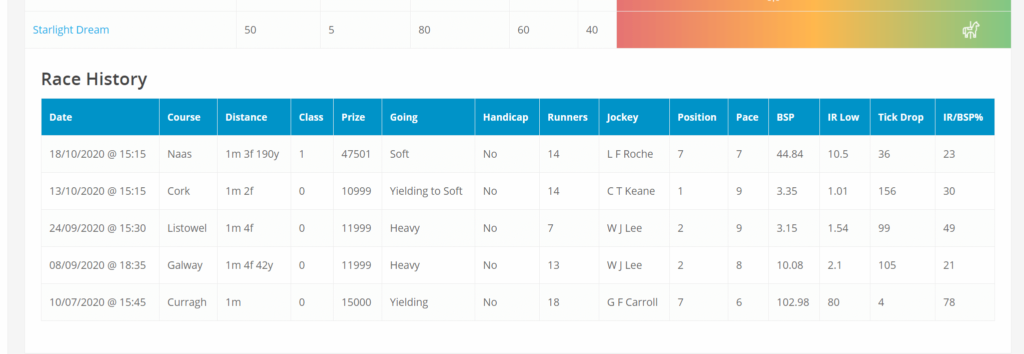
Here we can compare how the horse has run under similar conditions by using todays conditions against the data shown. The Race today is 1m 2f with Soft going. The horse has no previous runs at the track but the last time it ran over 1m 2f under similar going it won the race although the race today is more competitive so this is something you would need to decide if you are happy t pass the selection and trade or remove from your shortlist
Step 3.
Our final filter looks at the PACE analysis of the race. Ideally we want our selection to be one of the pacesetters in the race/ leading the race to help the price shorten in running as people back the selection. Using the pace map we can see that according to the stats Starlight Dream does like to race towards the head of the field so would be another positive, although there are others who also like to race prominently so again this would be another call to make.
The page explains what the figures mean but just to summarise ratings are between -9 through to +9. A figure of -9 indicates likely to lead whereas 9 indicates the horse tends to be slowly away or a hold up horse.
We would go through this process with all our shortlisted runners to then have our list of selections we wish to trade.
There will be times when we finish our 3 steps we end up with no selections but there may be times we end up with 2 in the same race.
Trade Ninja is currently free to use and covers DOB in more detail as well as TOB & QOB along with a great Team Stats tool for football
Feel free to join us, paper trade, or even trade your own selections using the vast amount of information available. Click here for details on how to register for free access
If you have your own method or filters please share your ideas in our members community